Key Moments in

The Research Process

Photo of Screens

“Stories resonated with our users.”

Interviews

5 Interviews

30 Minutes Each

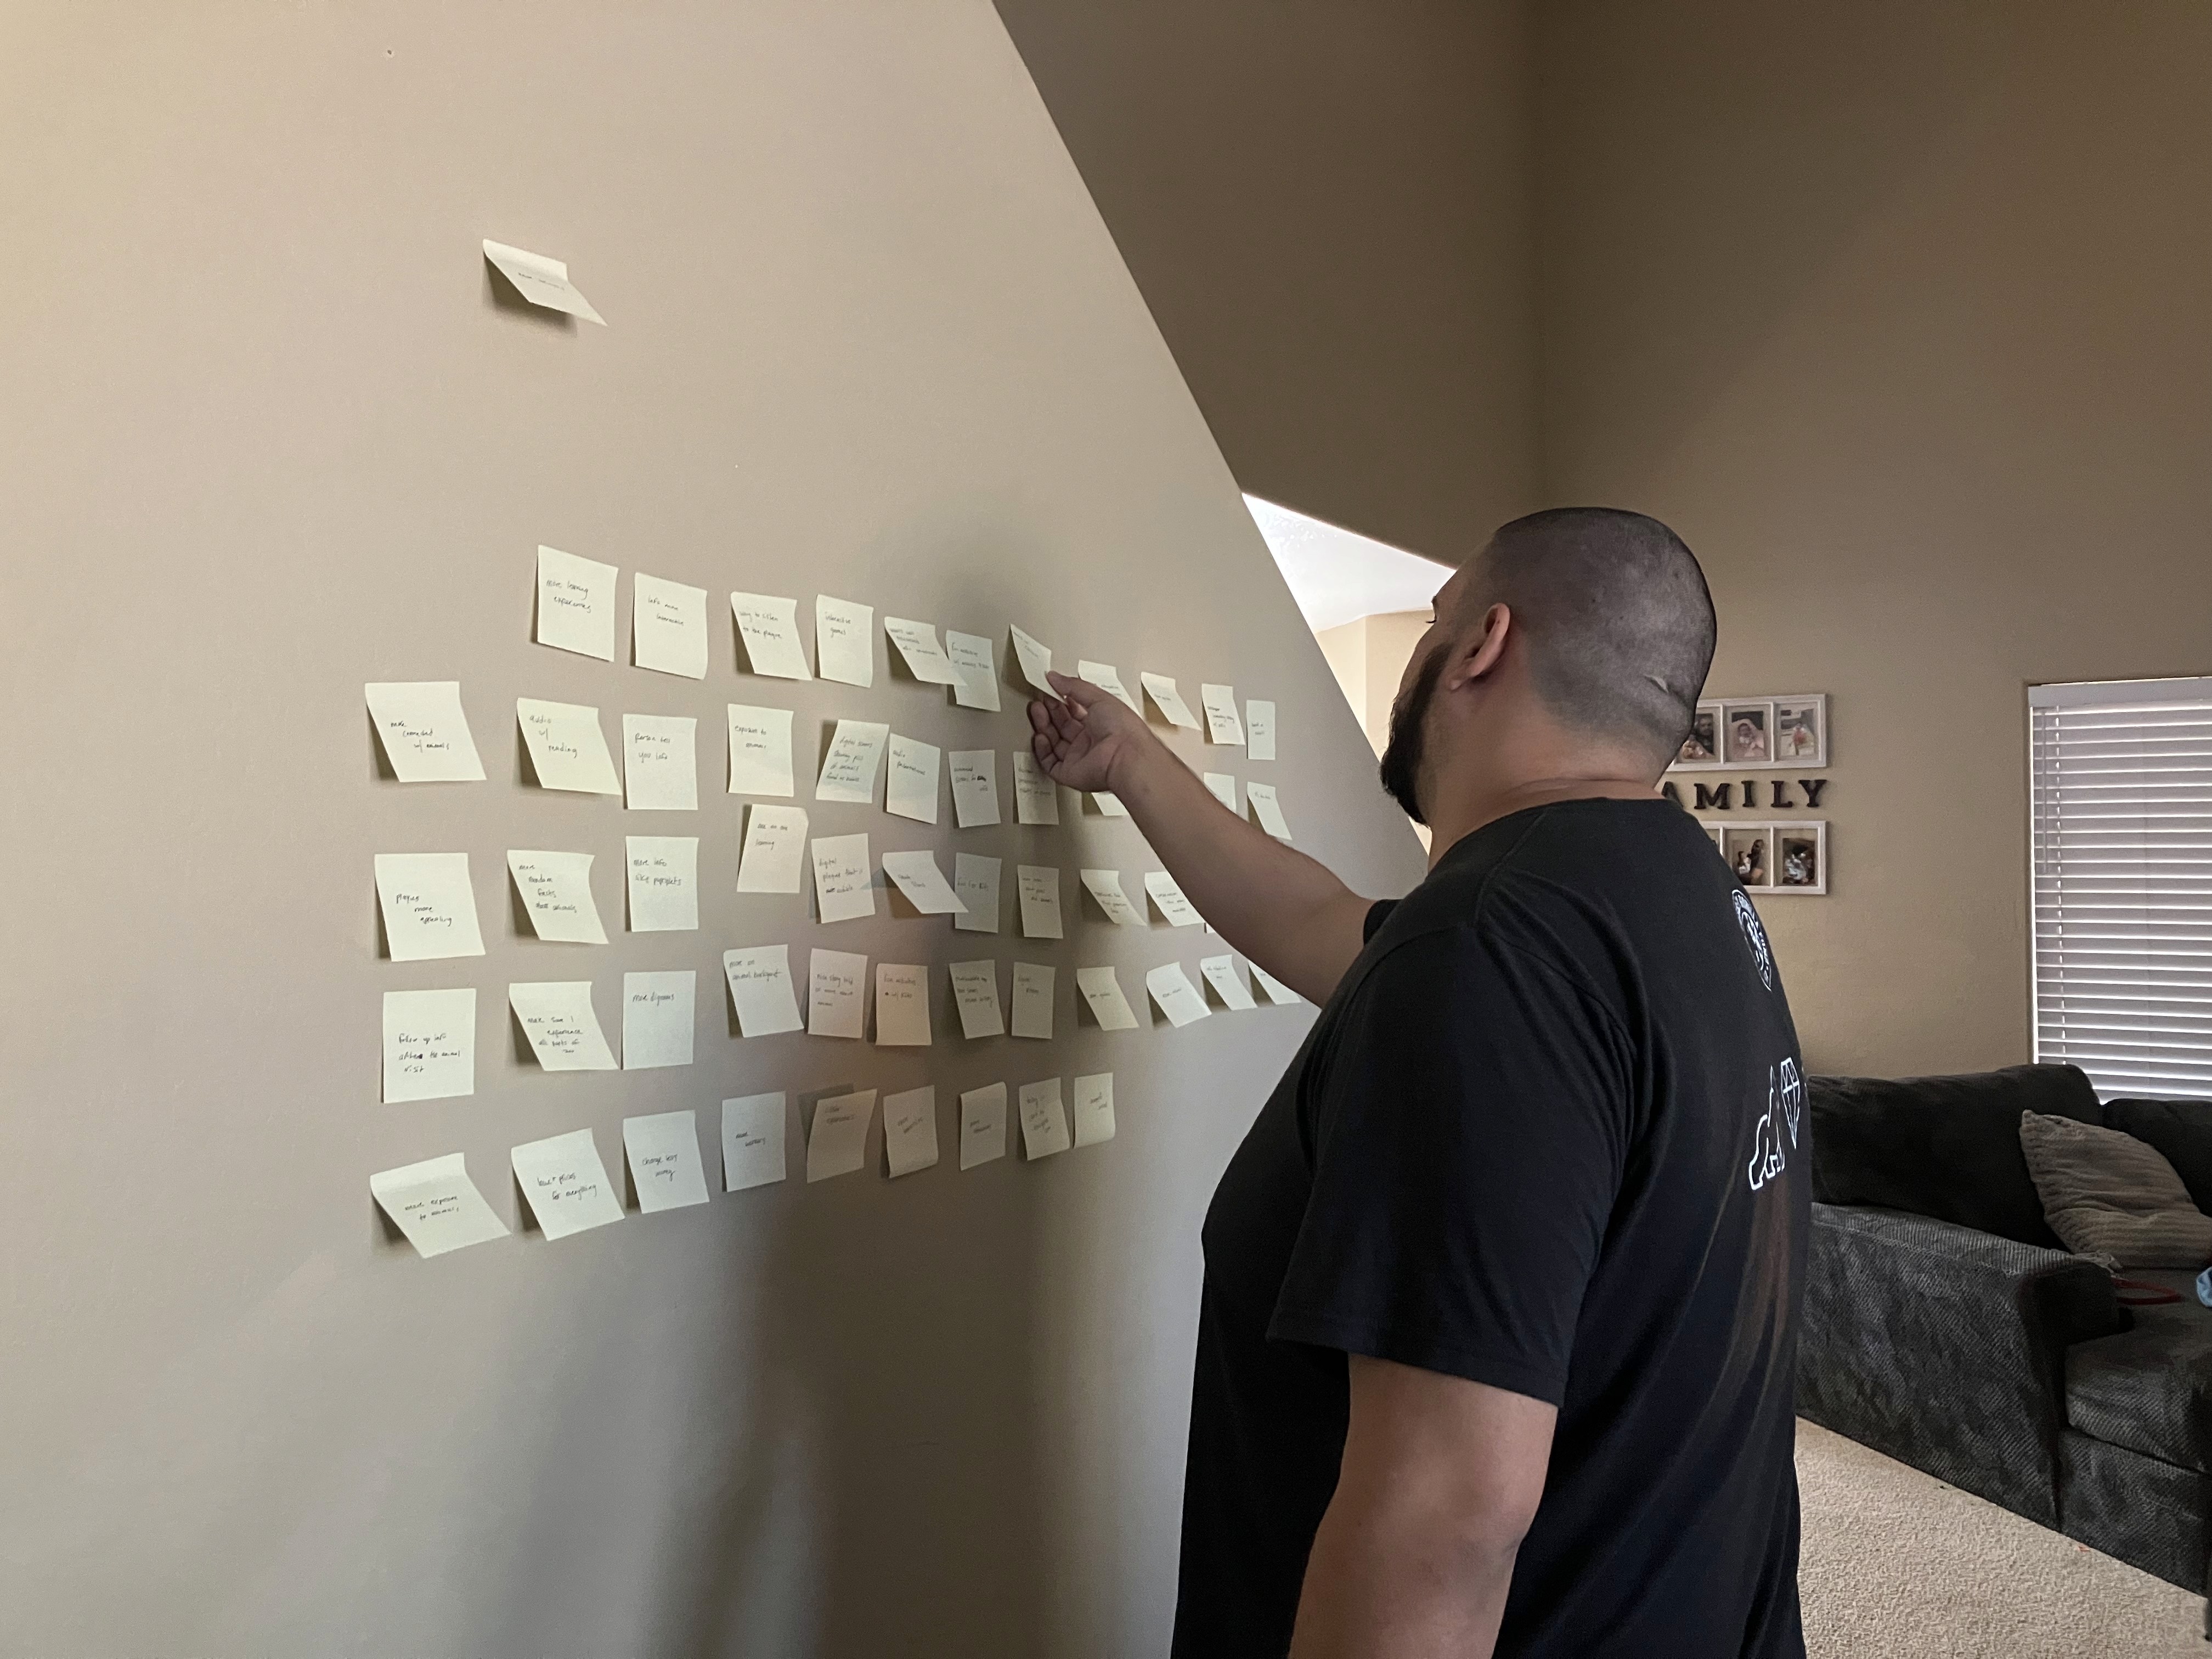
I gained the most insight when conducting interviews with users. Users began describing deep connections to animals they’d seen at the zoo, but these connections stemmed from a story that was told to them. For example, a particular user began describing two baby bears who were taken in due to their mother being hunted in the wilderness; this story resonated with them. 


I realized there was a deeper connection between our visitors and animals than I had initially assumed. I started to think about how I could create a solution that would allow us to connect people with animals in an educational and meaningful way.

The Research

Secondary

Research Studies

The big question at the beginning of our research was “What do users value from their visit?”  In our initial process, I thought that being able to read plaques and see animals was a sufficient visit. In a closely related research study on this topic, it was shown that out of 500 people, only 16 families with children under 18 read plaques. This threw me for a loop as I knew plaques were some of the easiest ways to get information out to the public and without them there would be a heavy emphasis on the keepers and tours. I began gathering surveys and user interviews to confirm if this particular study was true and if so, we would need to pivot our focus.

Photo of Screens

“94 of 100 people read plaques often”

The Survey

A Critical Moment

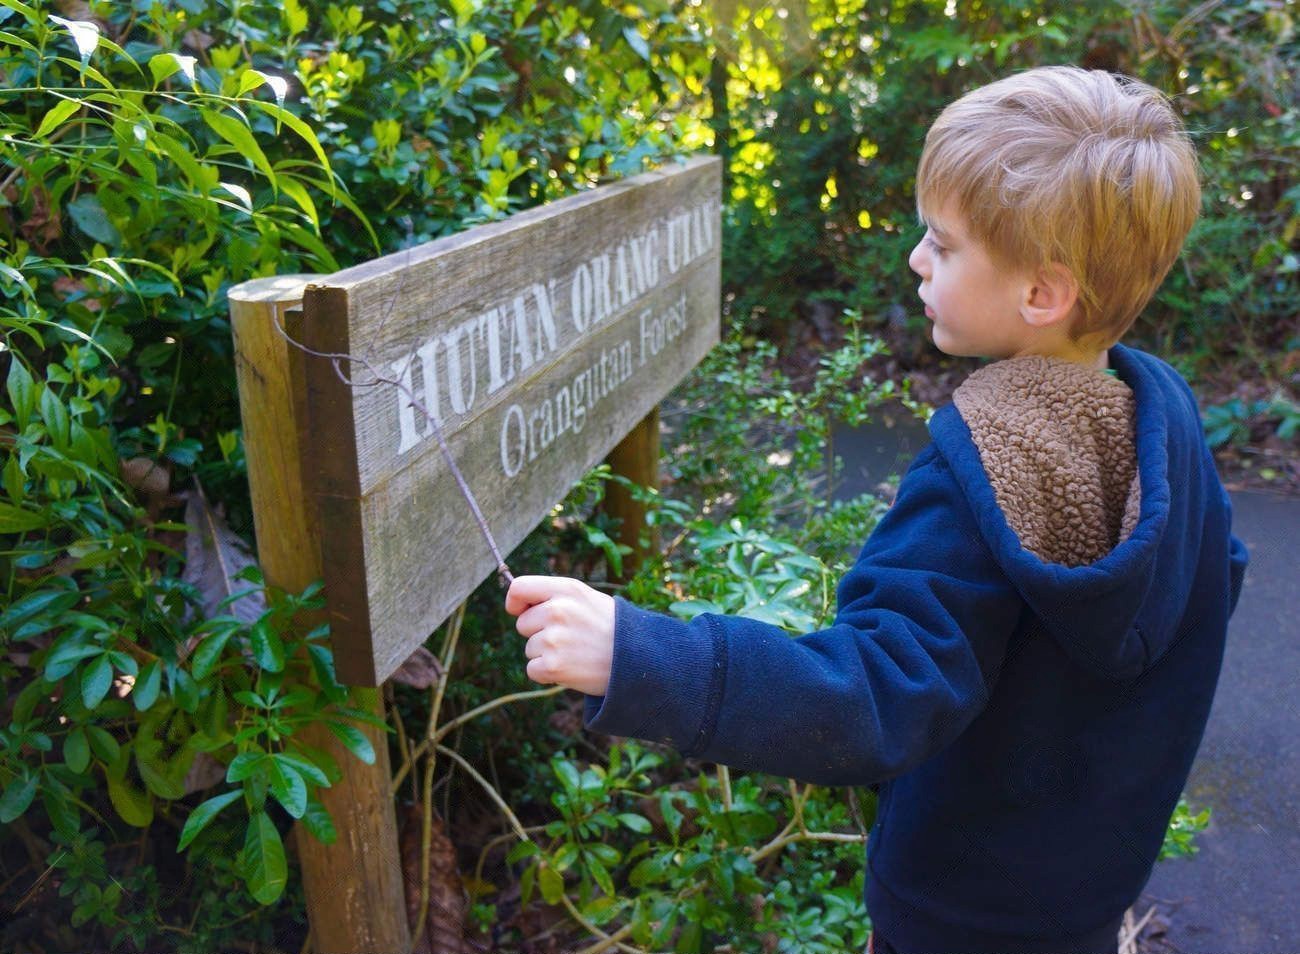
I was fortunate enough to have the ability to roll out a survey that involved some of the meatiest portions of our user interviews. My goal? To find out if plaques were important to zoo visitors and if so how often they read them. So I asked 100 people; “How often do you read plaques or information panels at the Zoo?”


A whopping 94 people said they read plaques often. This was great and aligned with what we learned from our user interviews. I knew how important the animal’s story was to the users based on my user interviews so next, I asked; On one of your visits to the Zoo, can you remember a specific animal’s name or story?


Only 48% of visitors were able to remember specific animals. This was great, I got such great insight from this survey and was able to see an area we could improve upon while adding value to both the users and the zoo.

“100+ ideas and solutions from our users…”

The Analysis

The Development

of My Findings

After receiving over 100+ ideas and solutions from our users, I began synthesizing my research and affinity mapping-like ideas. I was able to get a full picture of what users felt they were missing at their zoo. With 37 total mentions of redesigning or recreating the way, users experience plaques at the zoo was where I wanted to aim my focus.


I then later used this information to help ideate and create an MVP (minimum viable product) that would allow us to test our hypotheses against real users by creating a prototype that could be presented to gather feedback from zoo visitors who are familiar with reading and utilizing plaques at zoos. 


Where to Next?